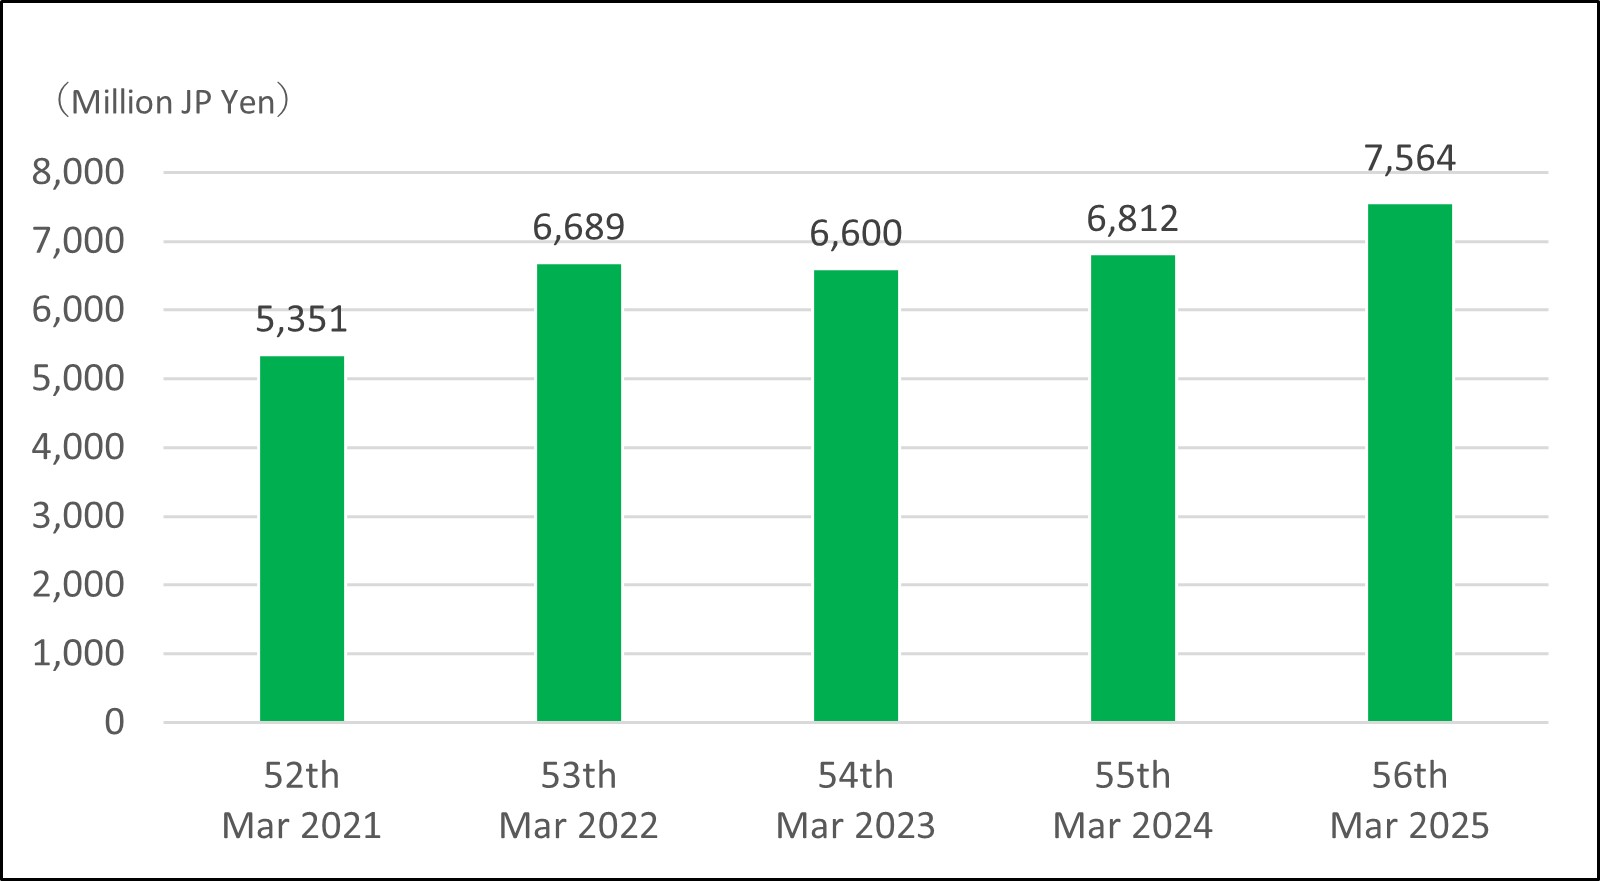
Net Sales
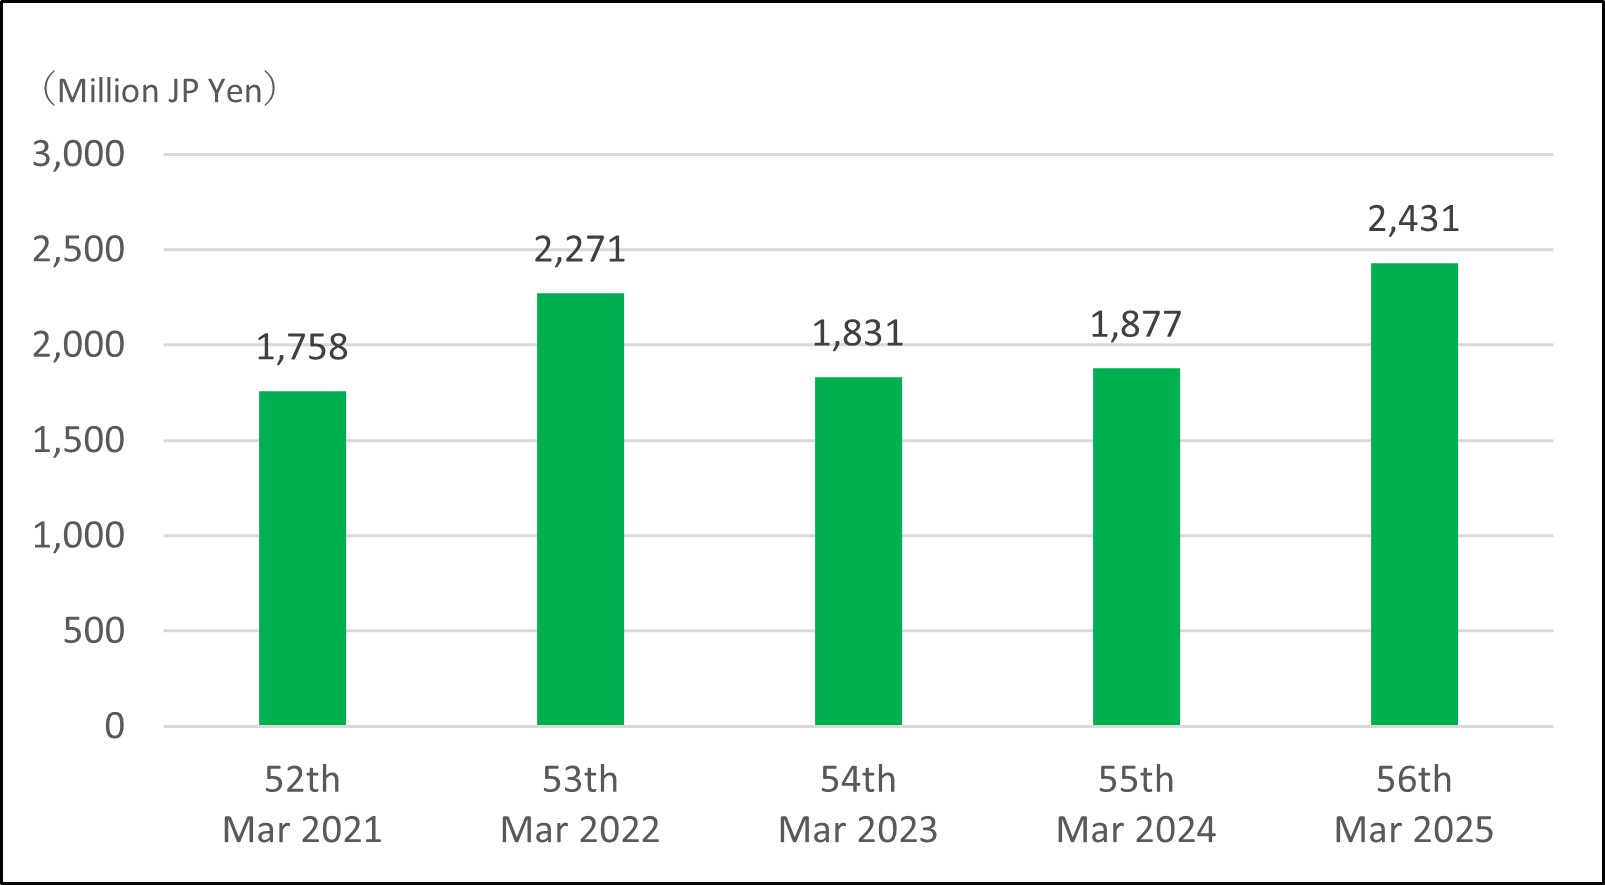
Ordinary Profit
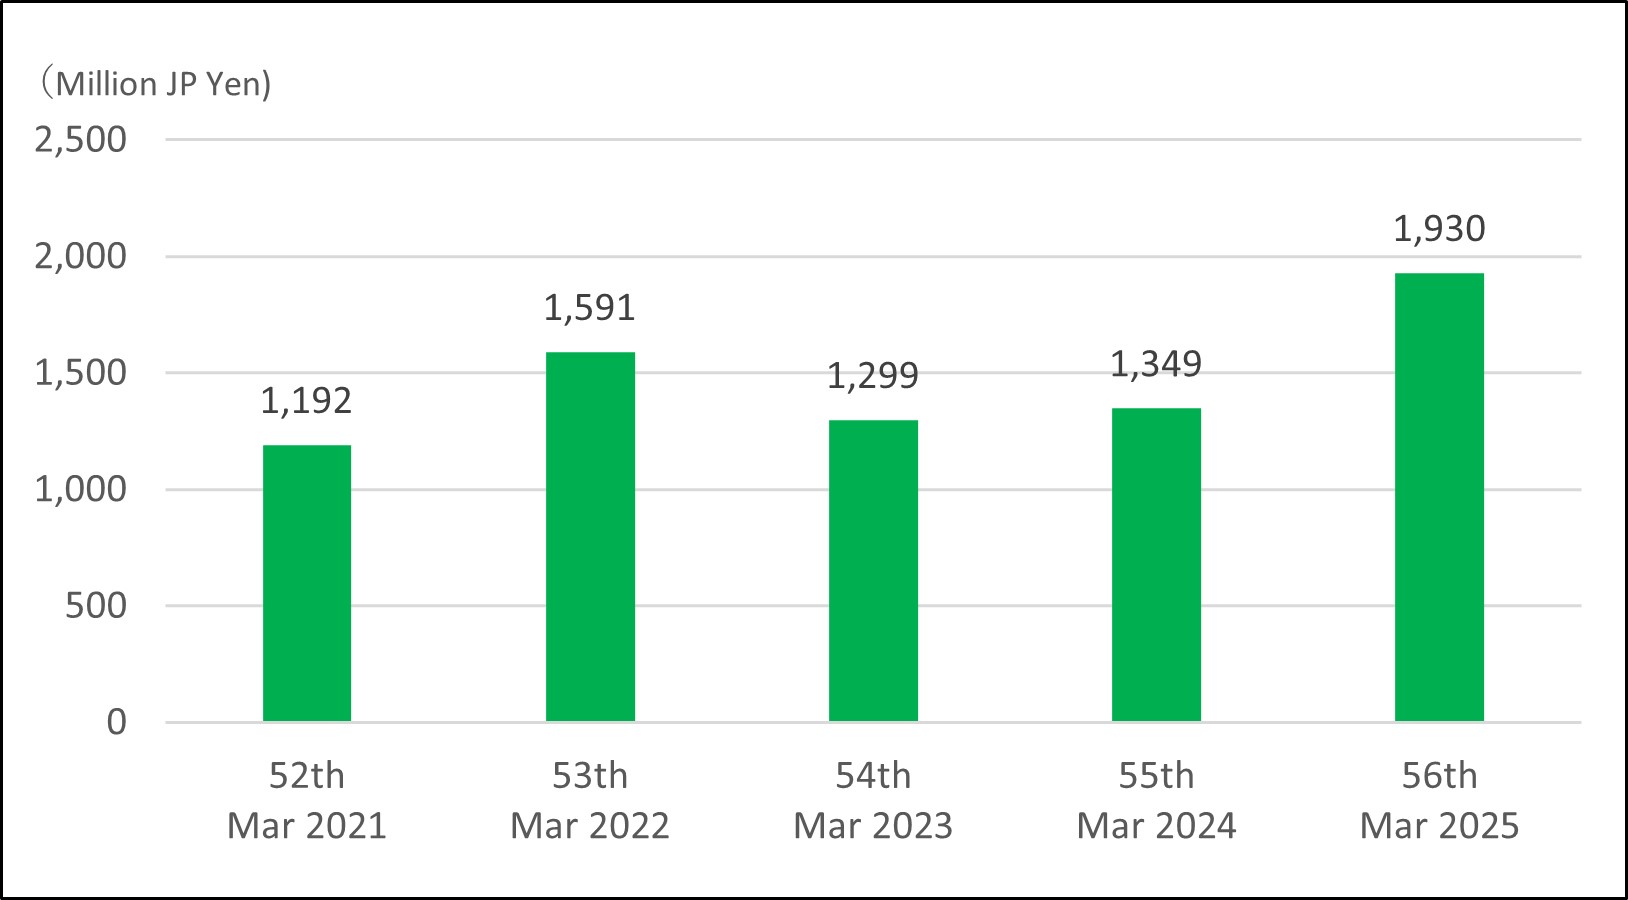
Net Profit
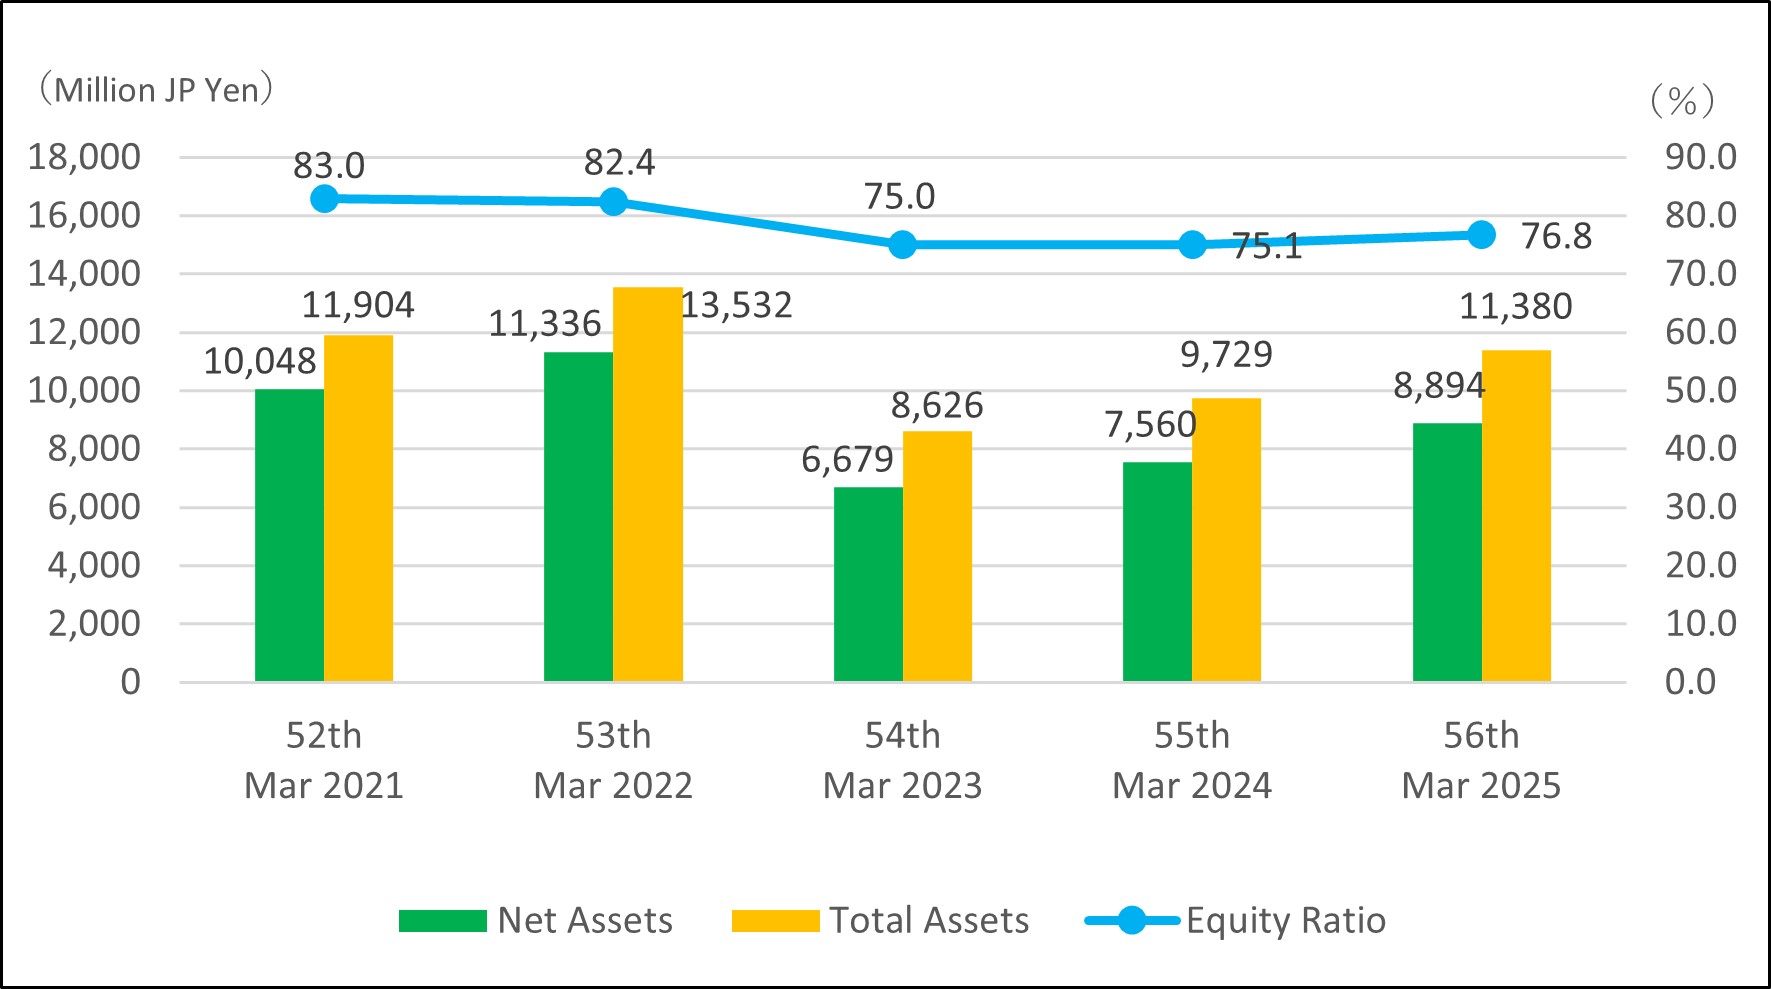
Total Assets Net Assets
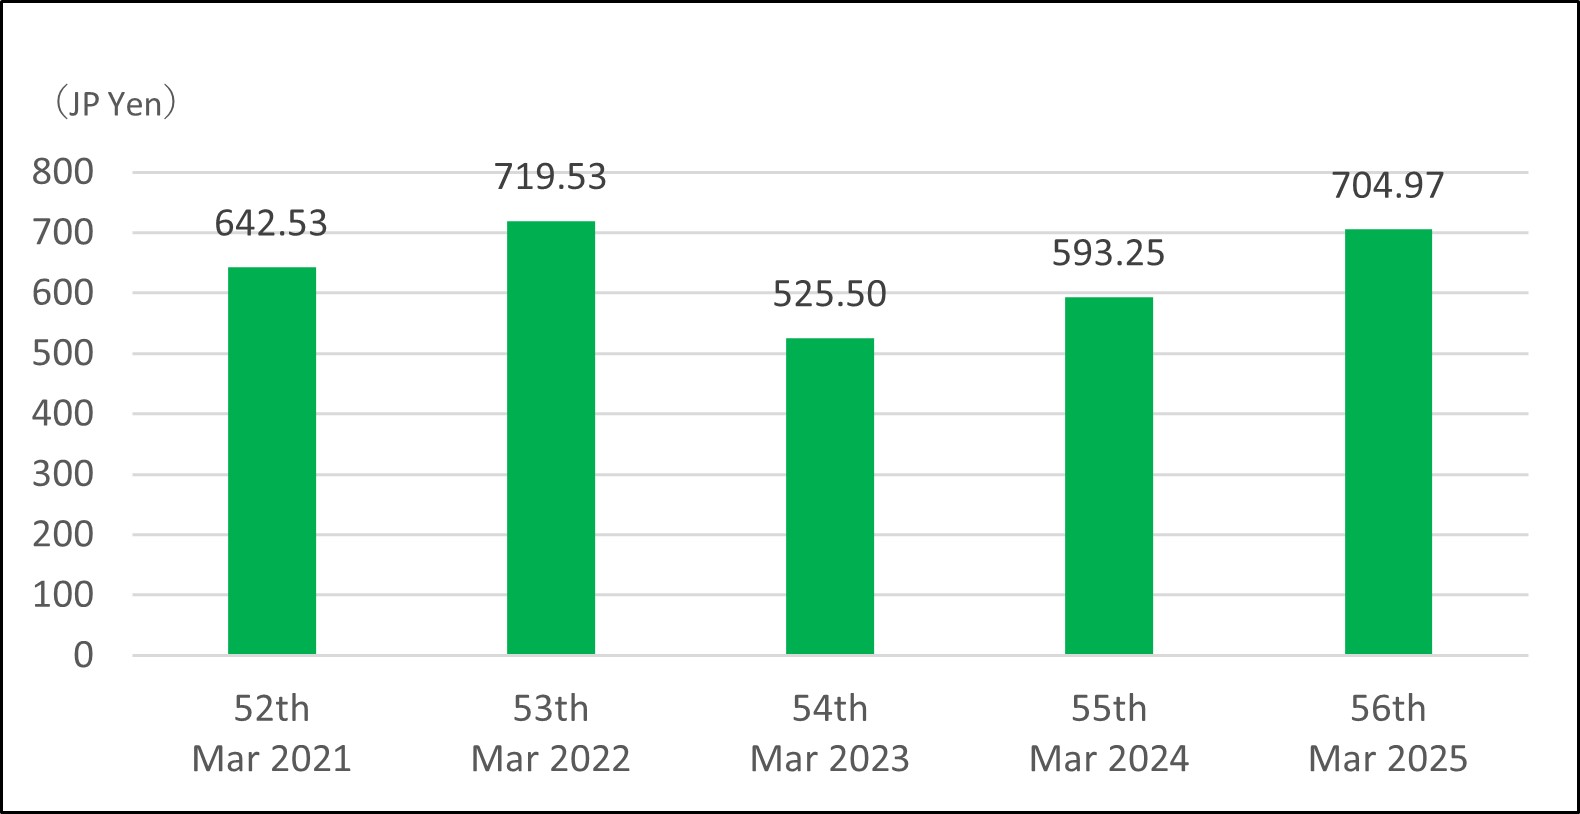
Book Value per Share
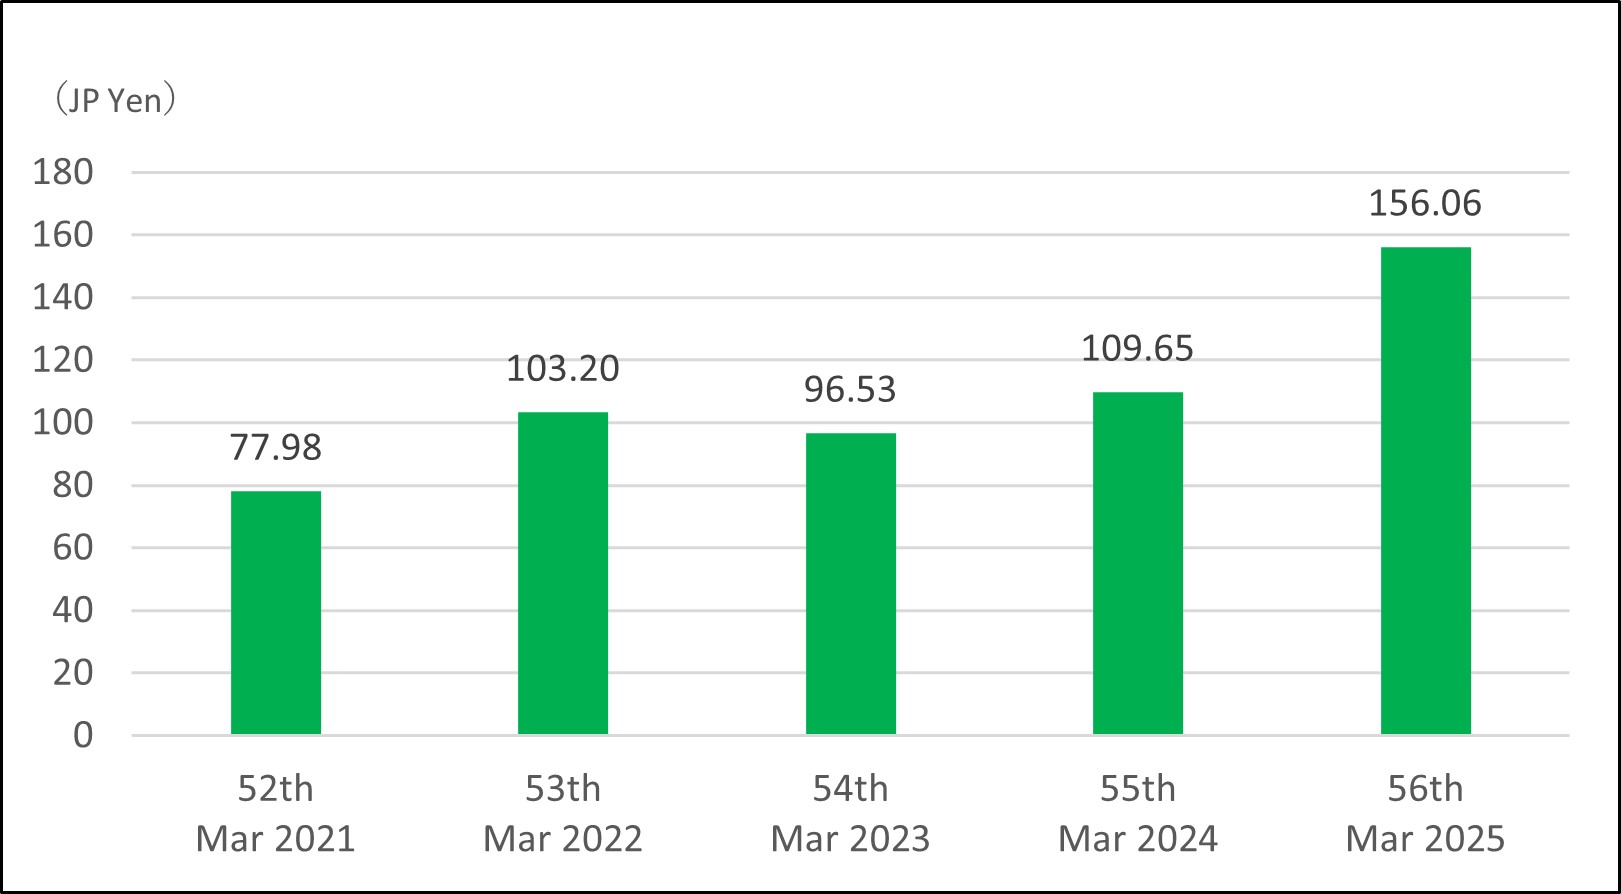
EPS
| 52th | 53th | 54th | 55th | 56th | |
|---|---|---|---|---|---|
| Mar. 2021 | Mar. 2022 | Mar. 2023 | Mar. 2024 | Mar. 2025 | |
| Net Sales | 5,351 | 6,689 | 6,600 | 6,812 | 7,564 |
| Ordinary Profit | 1,758 | 2,271 | 1,831 | 1,877 | 2,431 |
| Net Profit | 1,192 | 1,591 | 1,299 | 1,349 | 1,930 |
| Net Assets | 10,048 | 11,336 | 6,679 | 7,560 | 8,894 |
| Total Assets | 11,904 | 13,532 | 8,626 | 9,729 | 11,380 |
| Book Value per Share (JP Yen) | 642.53 | 719.53 | 525.50 | 593.25 | 704.97 |
| EPS (JP Yen) | 77.98 | 103.20 | 96.53 | 109.65 | 156.06 |
| Equity Ratio | 83.0 | 82.4 | 75.0 | 75.1 | 76.8 |