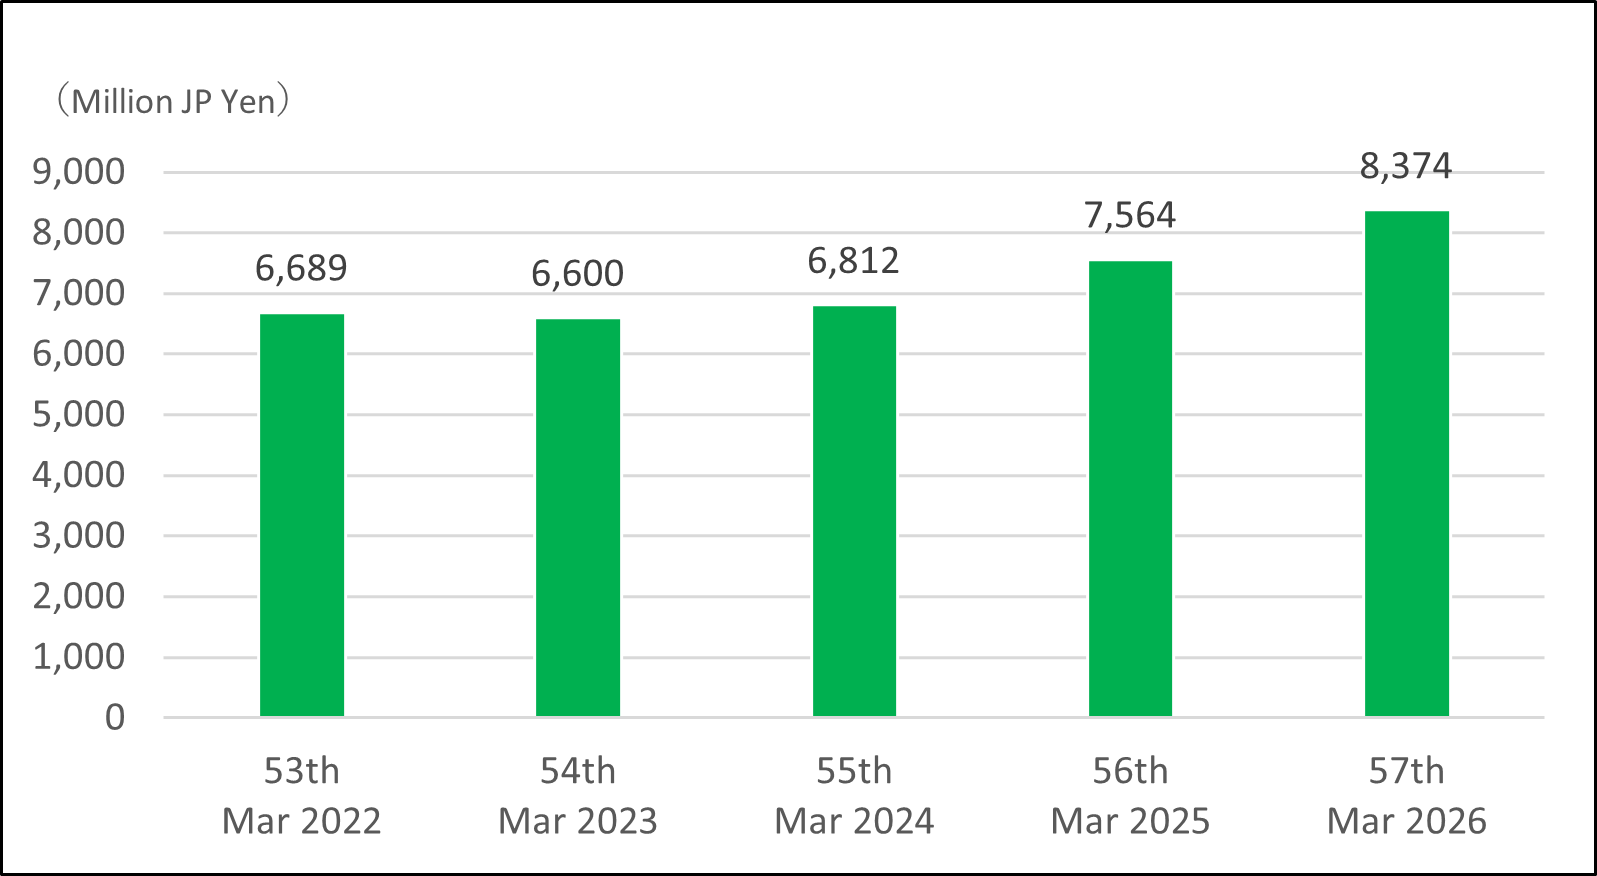
Net Sales
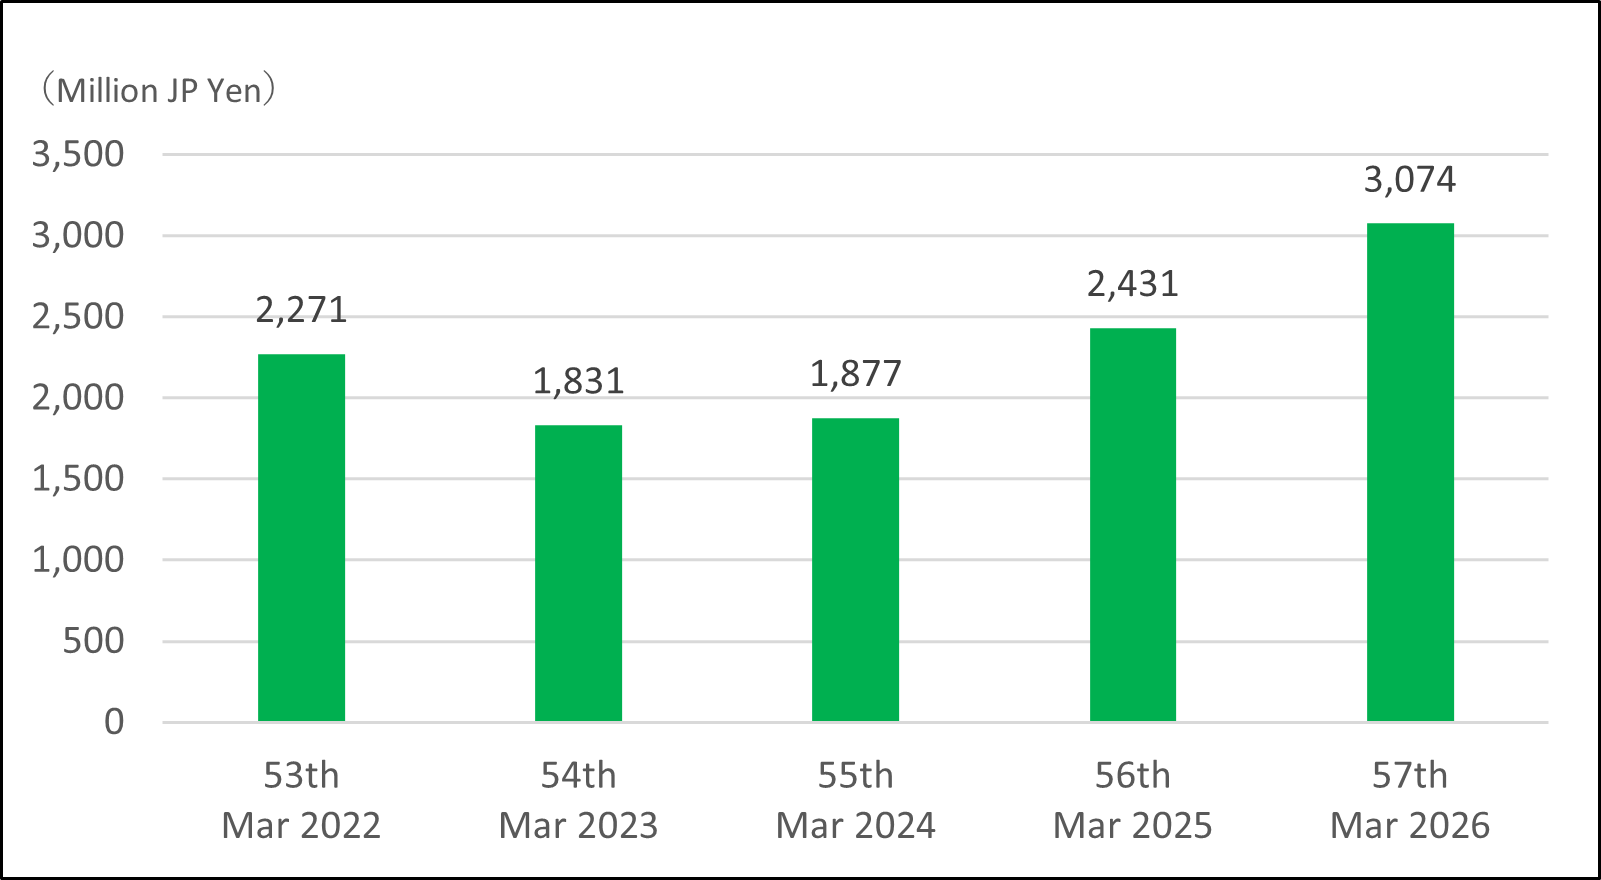
Ordinary Profit
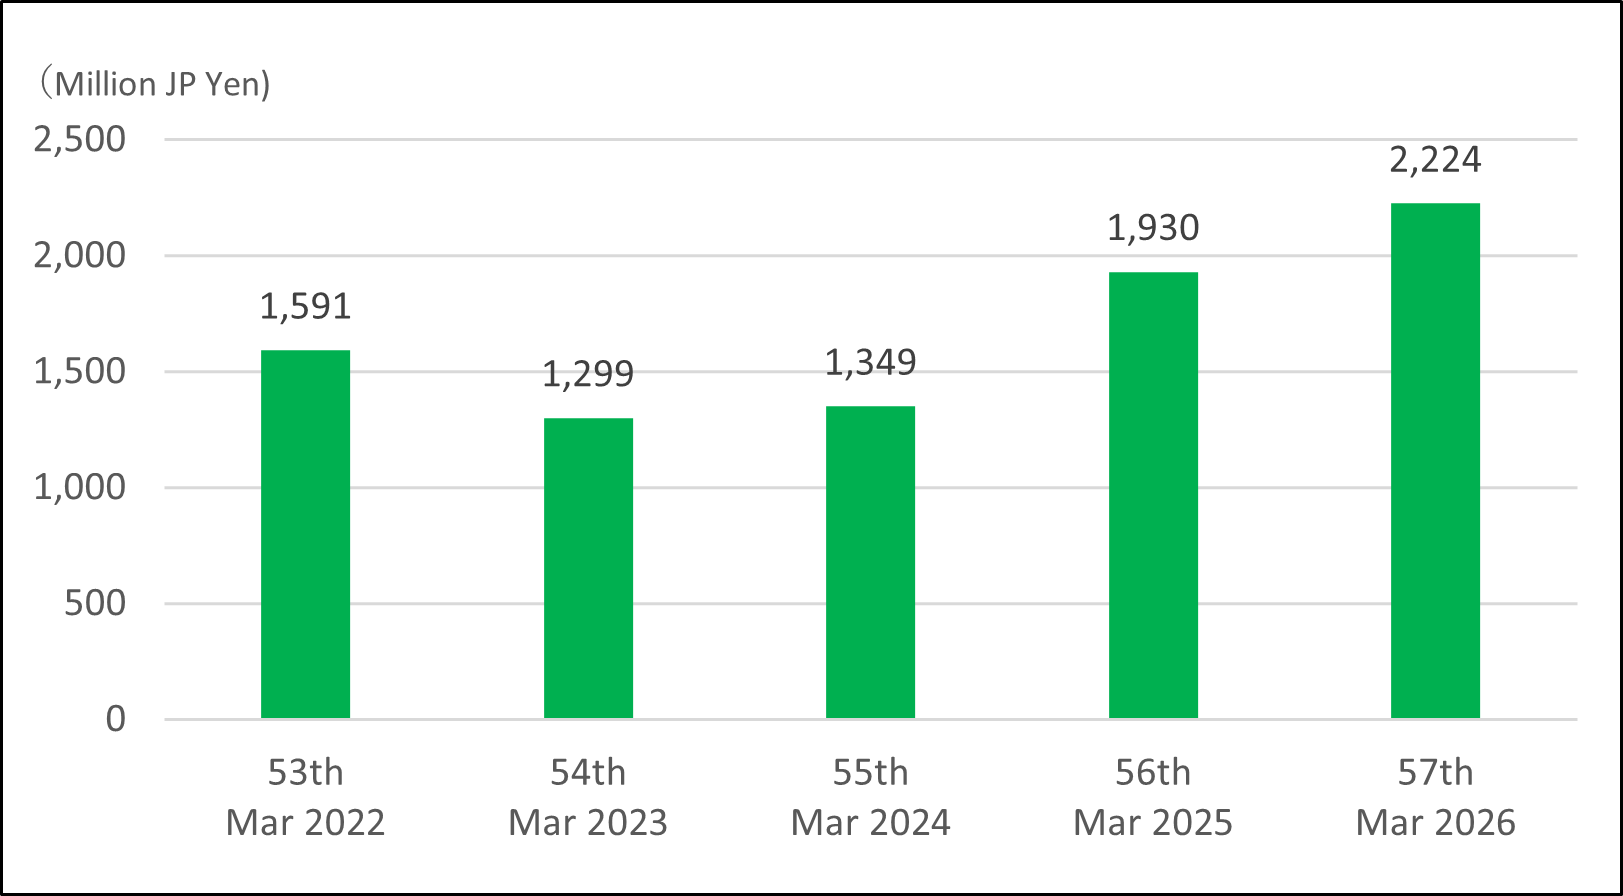
Net Profit
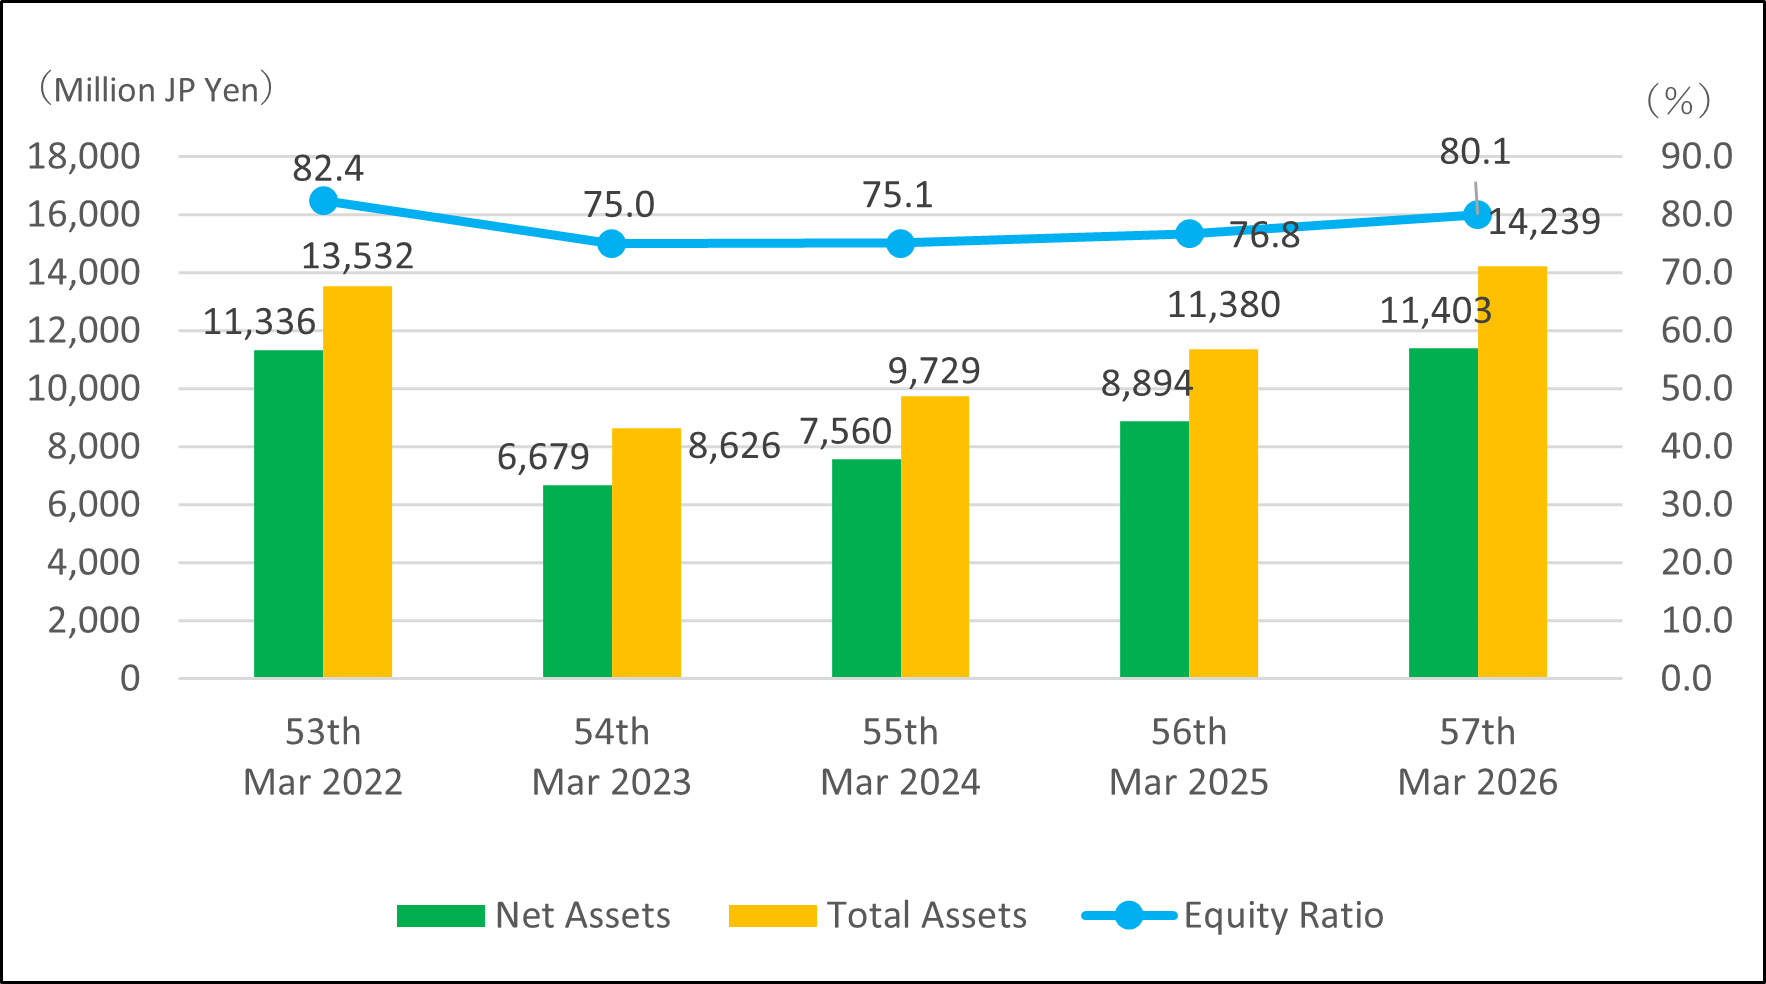
Total Assets Net Assets
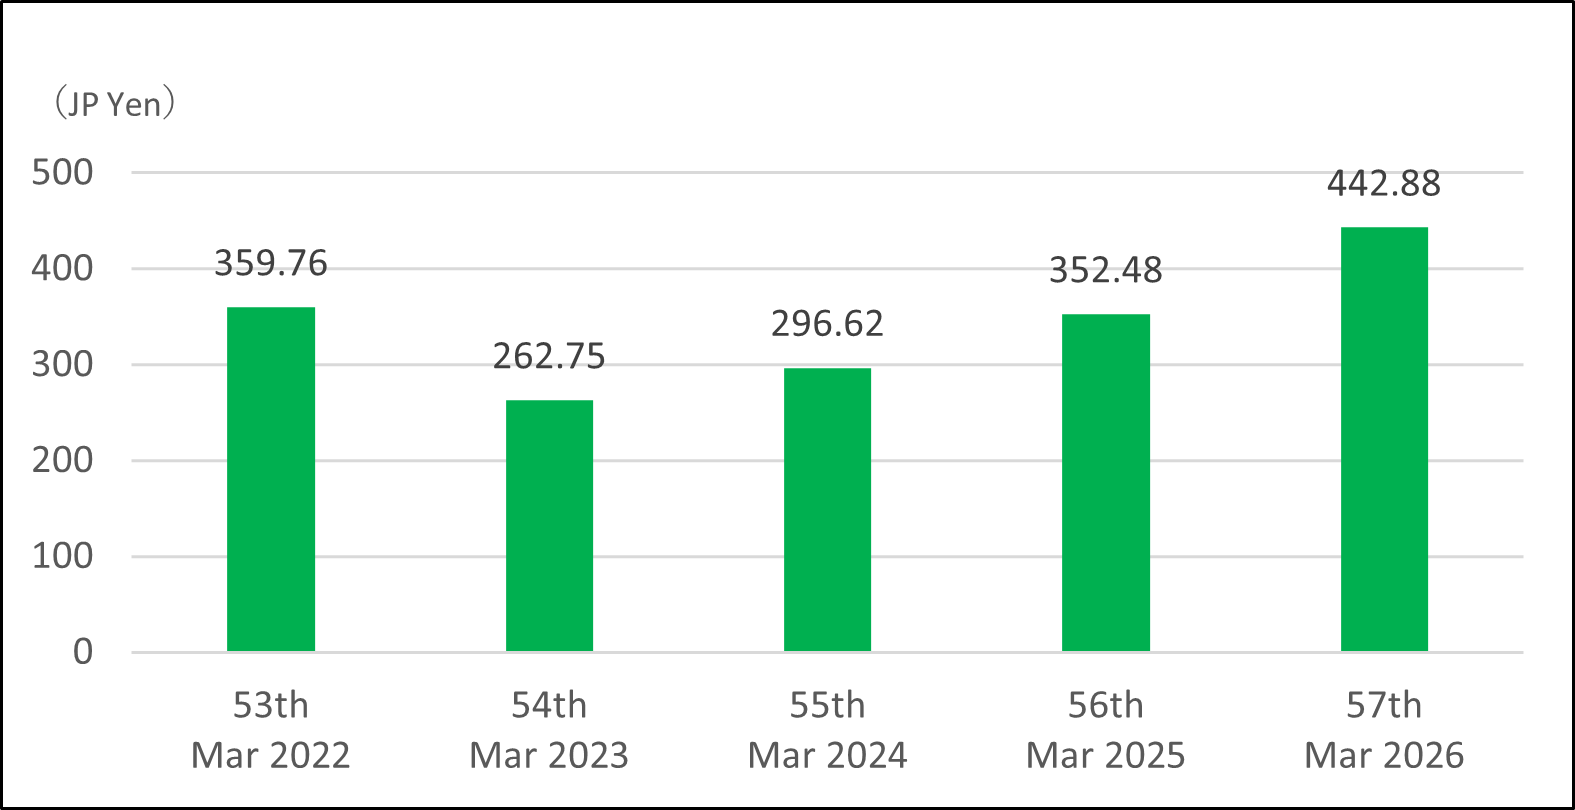
Book Value per Share
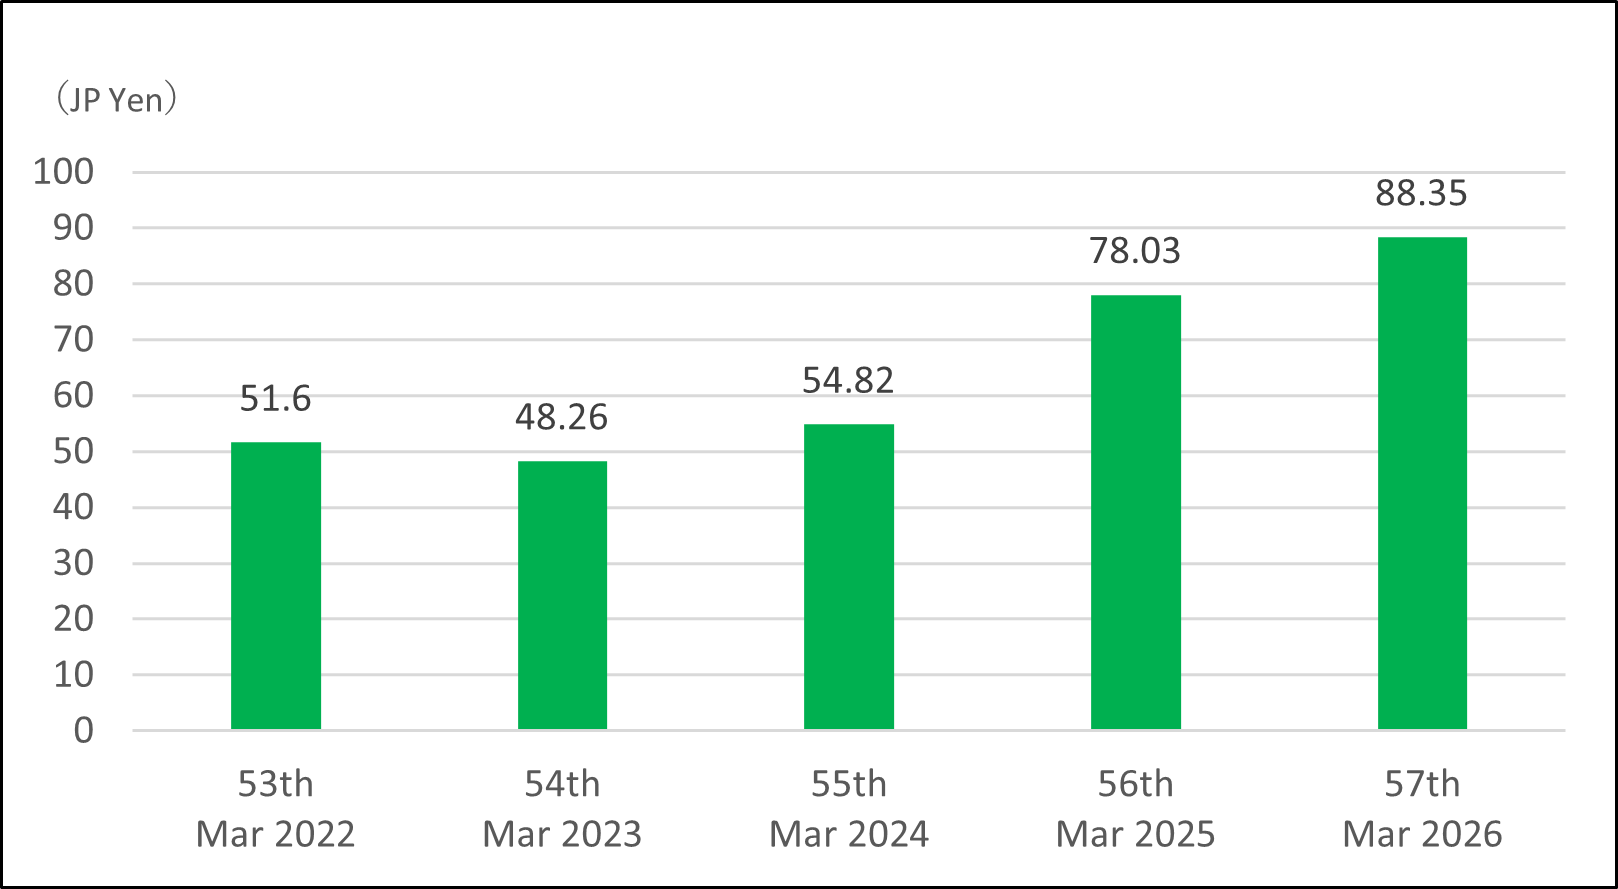
EPS
| 53th | 54th | 55th | 56th | 57th | |
|---|---|---|---|---|---|
| Mar. 2022 | Mar. 2023 | Mar. 2024 | Mar. 2025 | Mar. 2026 | |
| Net Sales | 6,689 | 6,600 | 6,812 | 7,564 | 8,374 |
| Ordinary Profit | 2,271 | 1,831 | 1,877 | 2,431 | 3,074 |
| Net Profit | 1,591 | 1,299 | 1,349 | 1,930 | 2,224 |
| Net Assets | 11,336 | 6,679 | 7,560 | 8,894 | 11,403 |
| Total Assets | 13,532 | 8,626 | 9,729 | 11,380 | 14,239 |
| Book Value per Share (JP Yen) | 359.76 | 262.75 | 296.62 | 352.48 | 442.88 |
| EPS (JP Yen) | 51.6 | 48.26 | 54.82 | 78.03 | 88.35 |
| Equity Ratio | 82.4 | 75.0 | 75.1 | 76.8 | 80.1 |